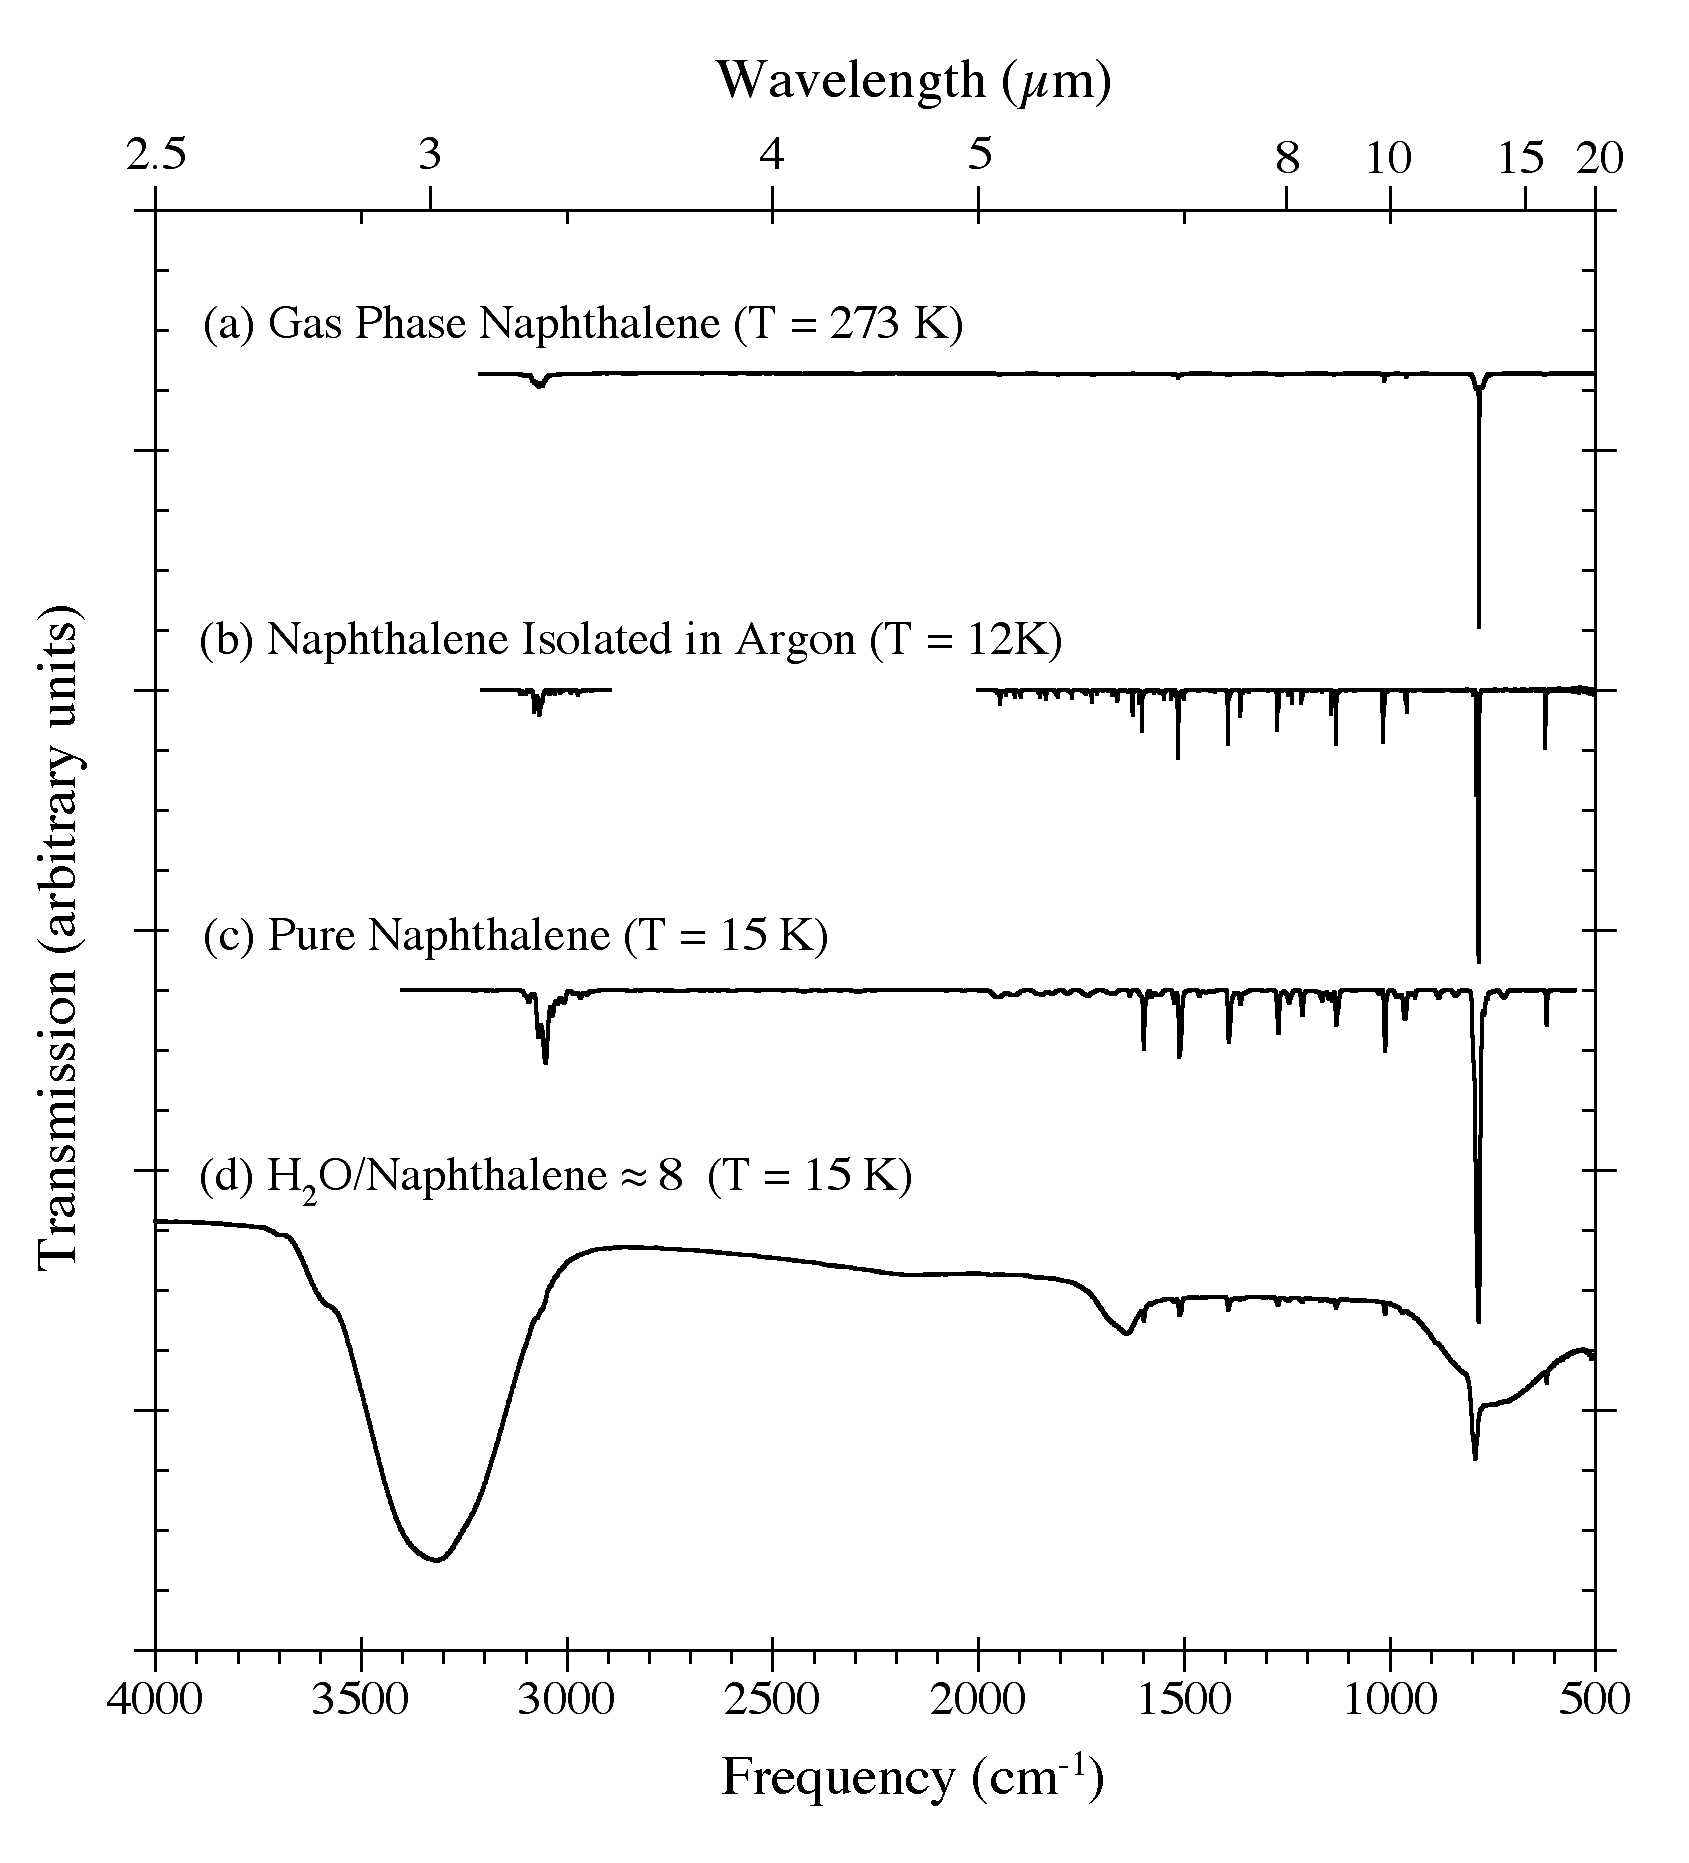
Figure 1. The 4000-500 cm-1 (2.5-20 microns) IR spectra of C10H8 in (a) the gas phase at 273 K (from Cane et al. 1996), (b) an argon matrix at 12 K (Ar/C10H8 > 1000; from Hudgins & Sandford 1998), (c) in pure form at 15 K, and (d) in an H2O matrix (H2O/C10H8 ~8) at 15 K. The pure C10H8 spectrum was obtained by directly vacuum depositing C10H8 vapor onto a CsI window. Note how the strong 3300 cm-1 (3.0 microns) O-H stretching band of H2O reduces the spectral contrast of the aromatic C-H stretching bands between 3150 and 2900 cm-1 (3.18-3.45 microns).
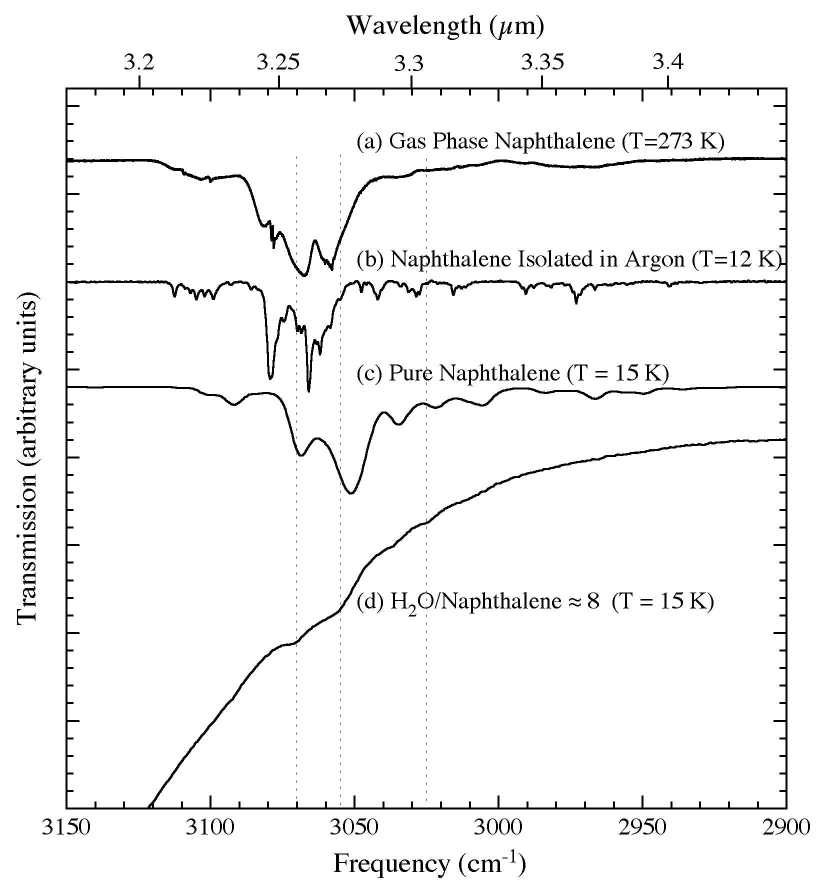
Figure 2. The 3150-2900 cm-1 (3.17-3.45 microns) IR spectra of C10H8 (a) in the gas phase at 273 K (from Cane et al. 1996), (b) in an argon matrix at 12 K (Ar/C10H8 > 1000; from Hudgins & Sandford 1998), (c) in pure form at 15 K, and (d) in an H2O matrix (H2O/C10H8 ~ 8) at 15 K. The characteristic profiles of the P, Q, R branches of the gas phase C10H8 are not obvious due to extensive overlapping of multiple C-H stretching modes.
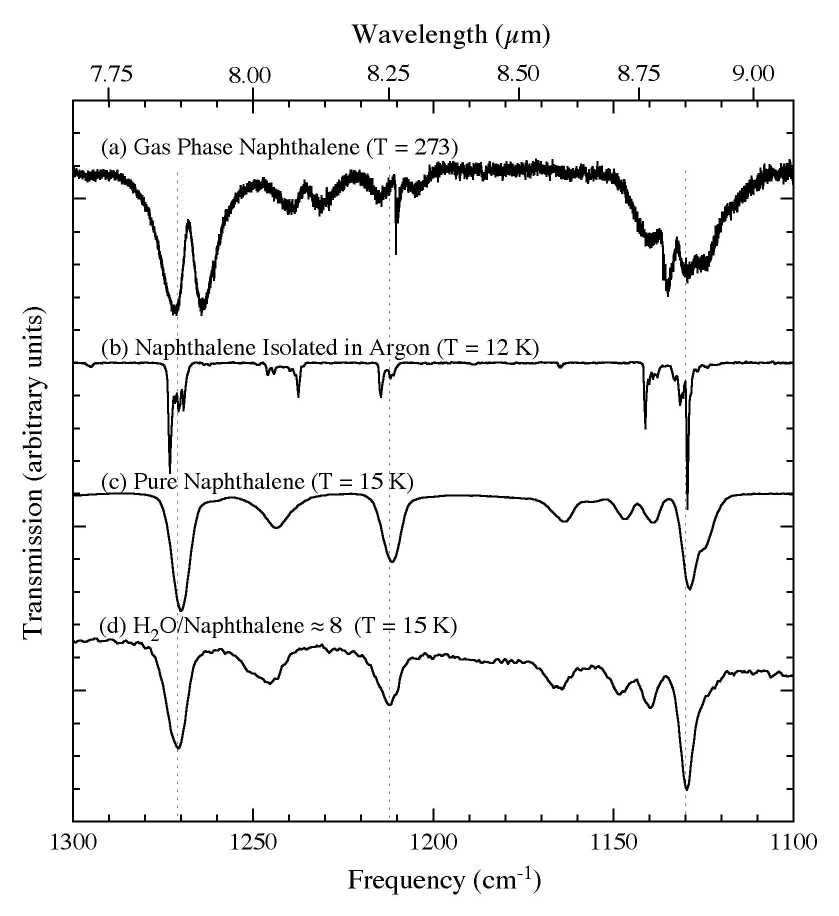
Figure 3. The 1300-1100 cm-1 (7.7-9.1 microns) IR spectra of C10H8
(a) in the gas phase at 273 K (from Cane et al. 1996), (b) in an argon matrix at 12 K (Ar/C10H8 > 1000; from Hudgins & Sandford 1998), (c) in pure form at 15 K, and (d) in an H2O matrix (H2O/C10H8
~ 8) at 15 K. Solid state interactions result in bands broadening,
blending, shifting, and, in some cases, changing their relative
strengths.
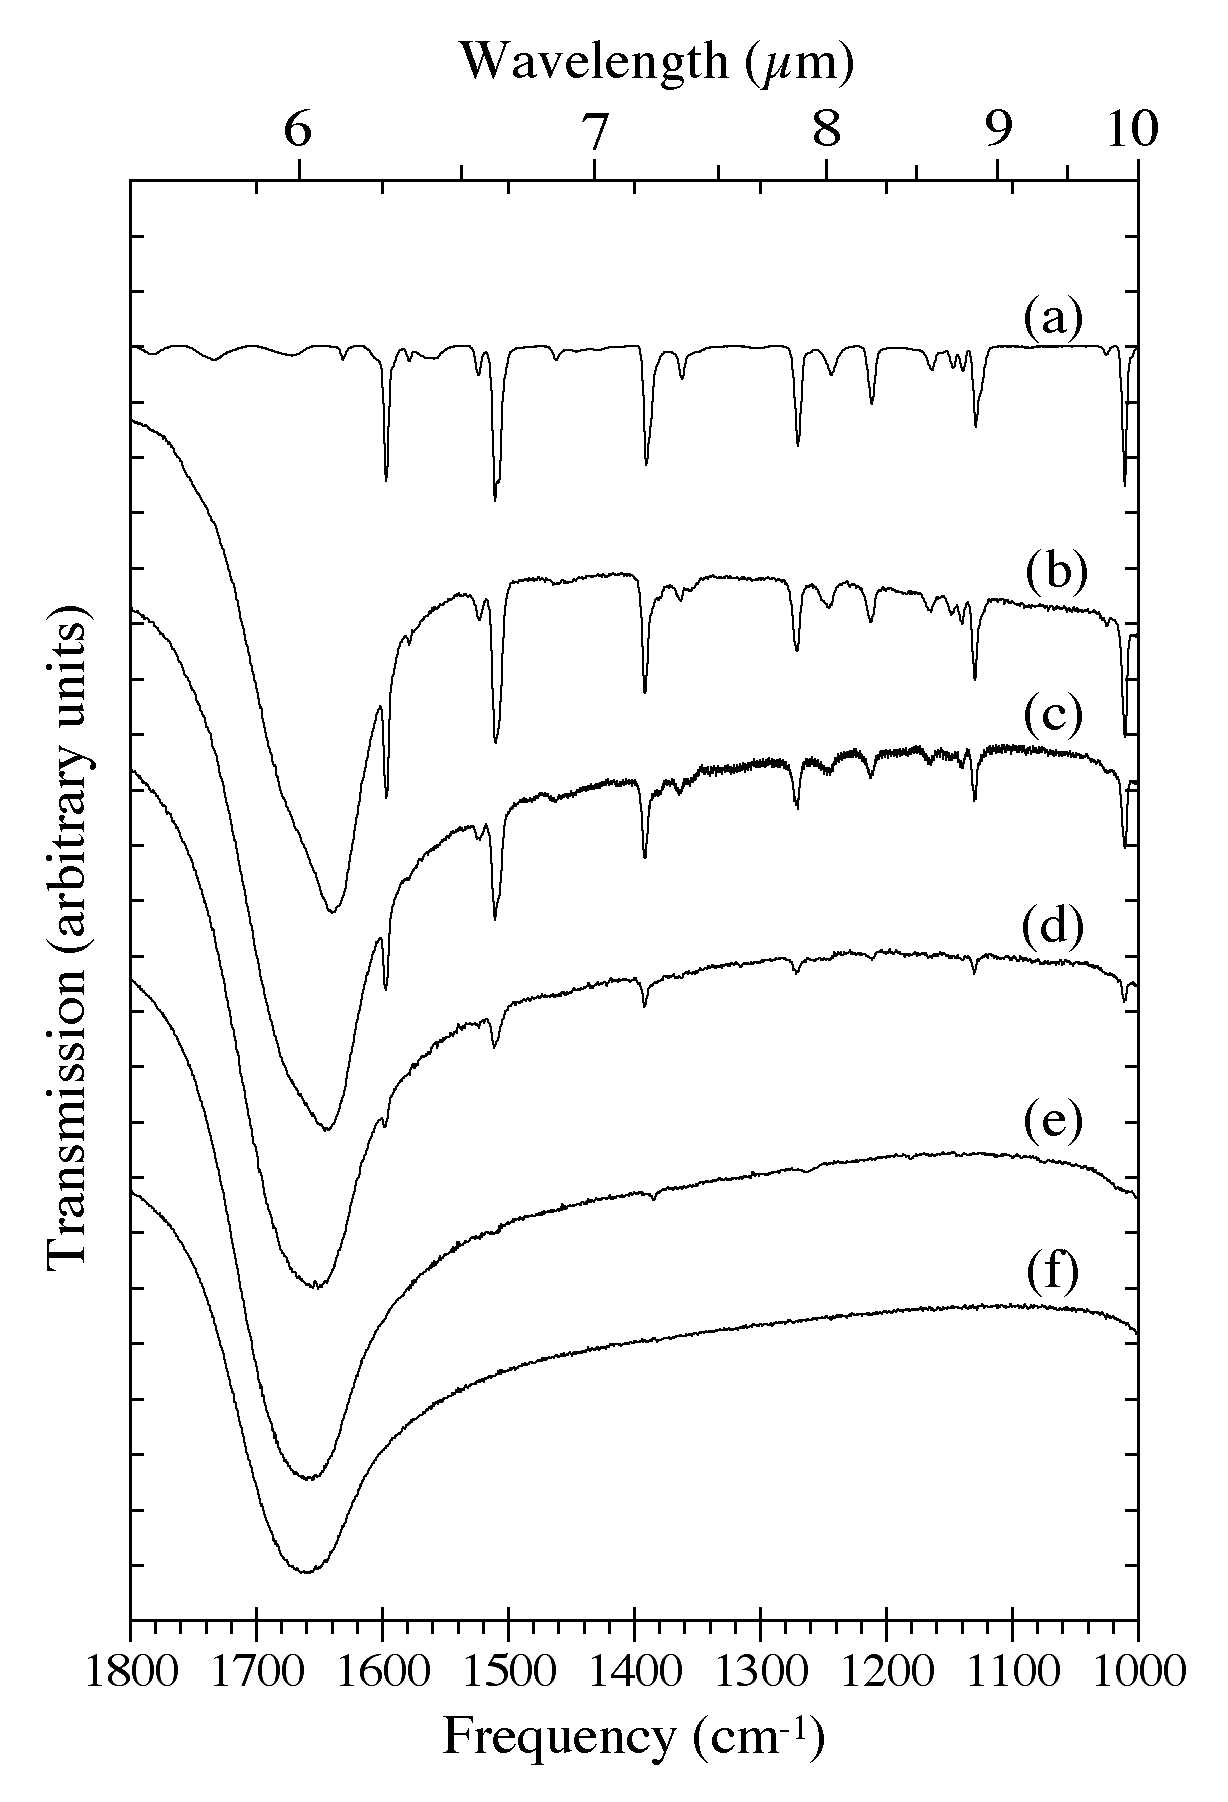
Figure 4. The 1800-1000 cm-1 (5.56-10.0 microns) IR spectra of H2O-C10H8 ices as a function of C10H8
concentration. Naphthalene bands in this region are largely due to C-C
stretching and C-H in-plane bending modes.The spectra are from (a) pure
C10H8, (b) H2O/C10H8 ~ 8, (c) H2O/C10H8 ~ 15, (d) H2O/C10H8 ~ 40, (e) H2O/C10H8
~ 80, and (f) pure H2O. The very broad band centered near 1660 cm-1 (6.0 microns) is due to H-O-H bending modes of the H2O. All spectra in this figure were taken from samples deposited and maintained at 15 K.
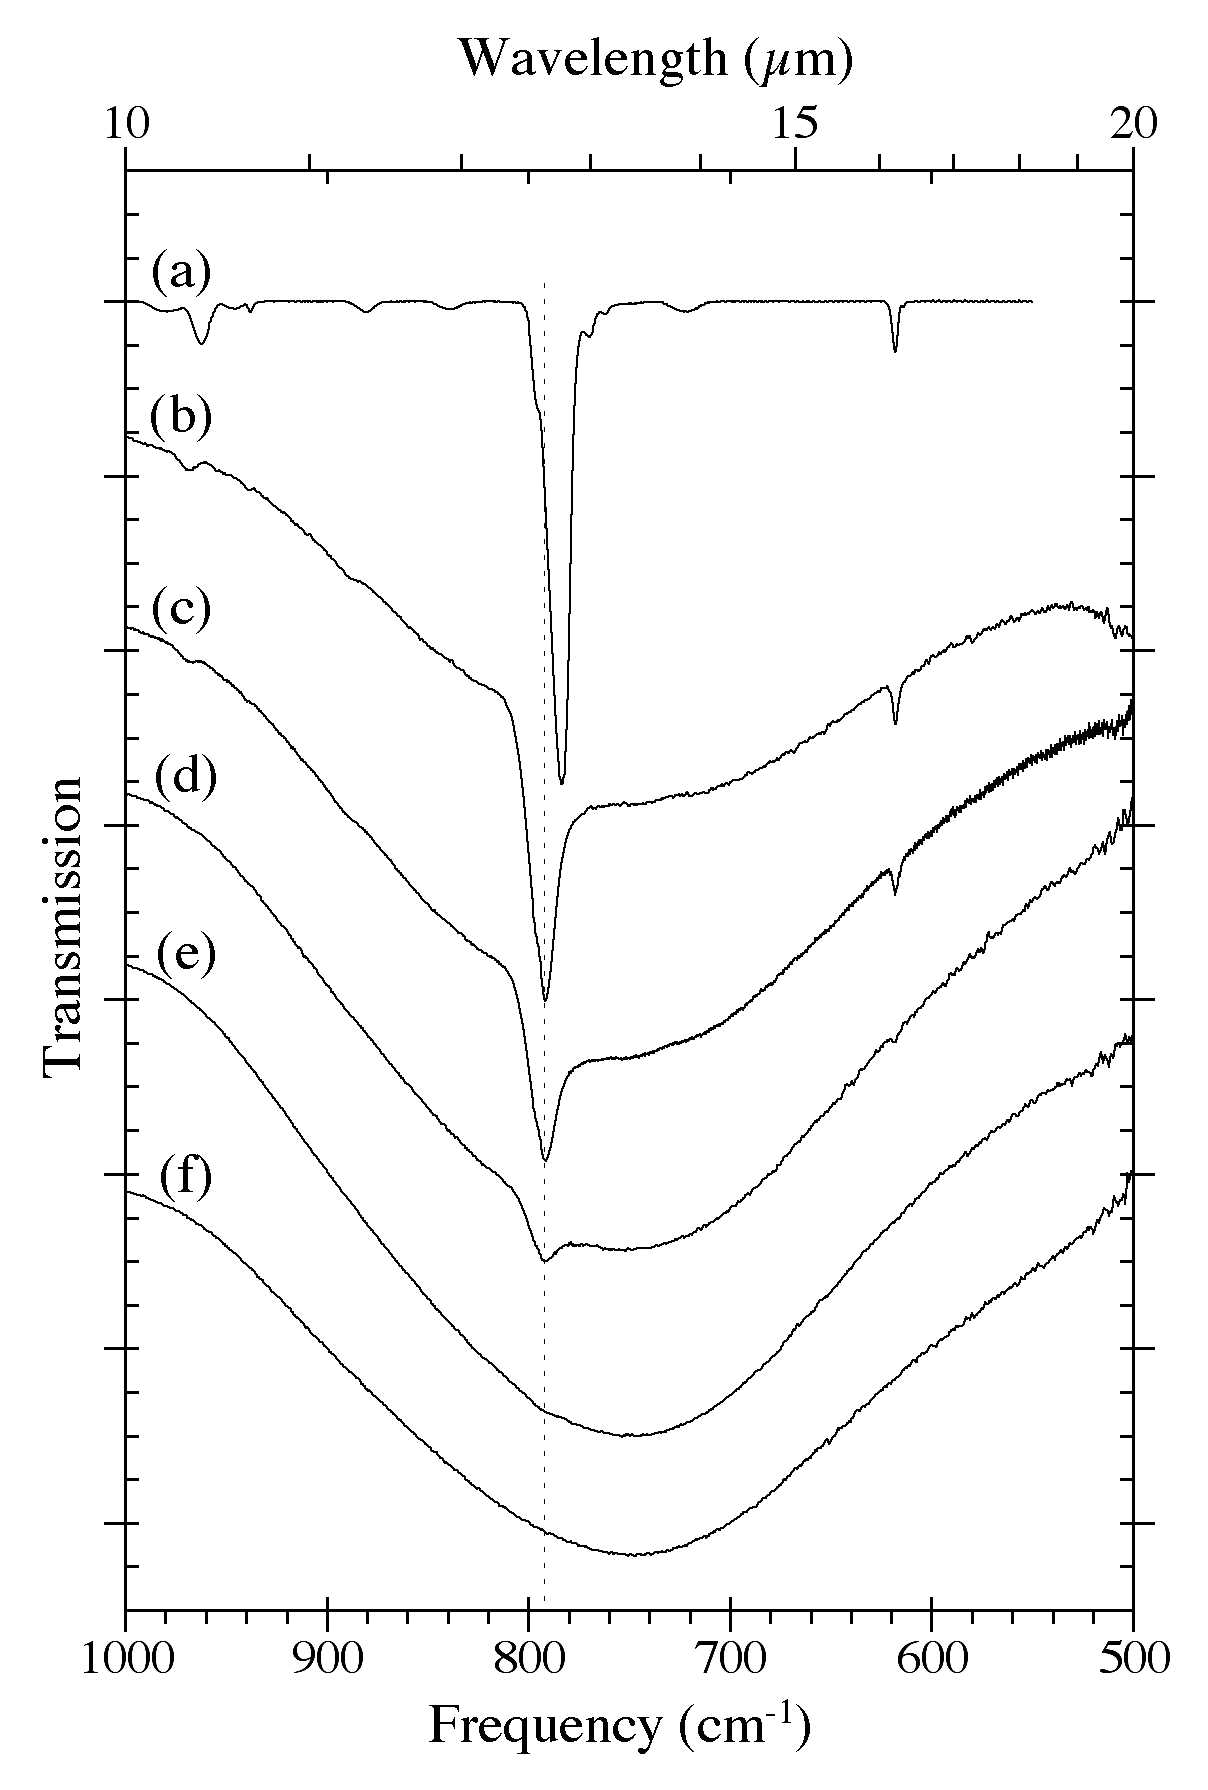
Figure 5. The 1000-500 cm-1 (10.0-20.0 microns) IR spectra of H2O-C10H8 ices as a function of C10H8
concentration. Naphthalene bands in this region are largely due to C-H
out-of-plane bending modes. he spectra are from (a) pure C10H8,
(b) H2O/C10H8 ~ 8, (c) H2O/C10H8 ~ 15, (d) H2O/C10H8 ~ 40, (e) H2O/C10H8 ~ 80, and (f) pure H2O. The very broad band centered near 750 cm-1 (13.3 microns) is due to librational modes of the H2O. All spectra in this figure were taken from samples deposited and maintained at 15 K.
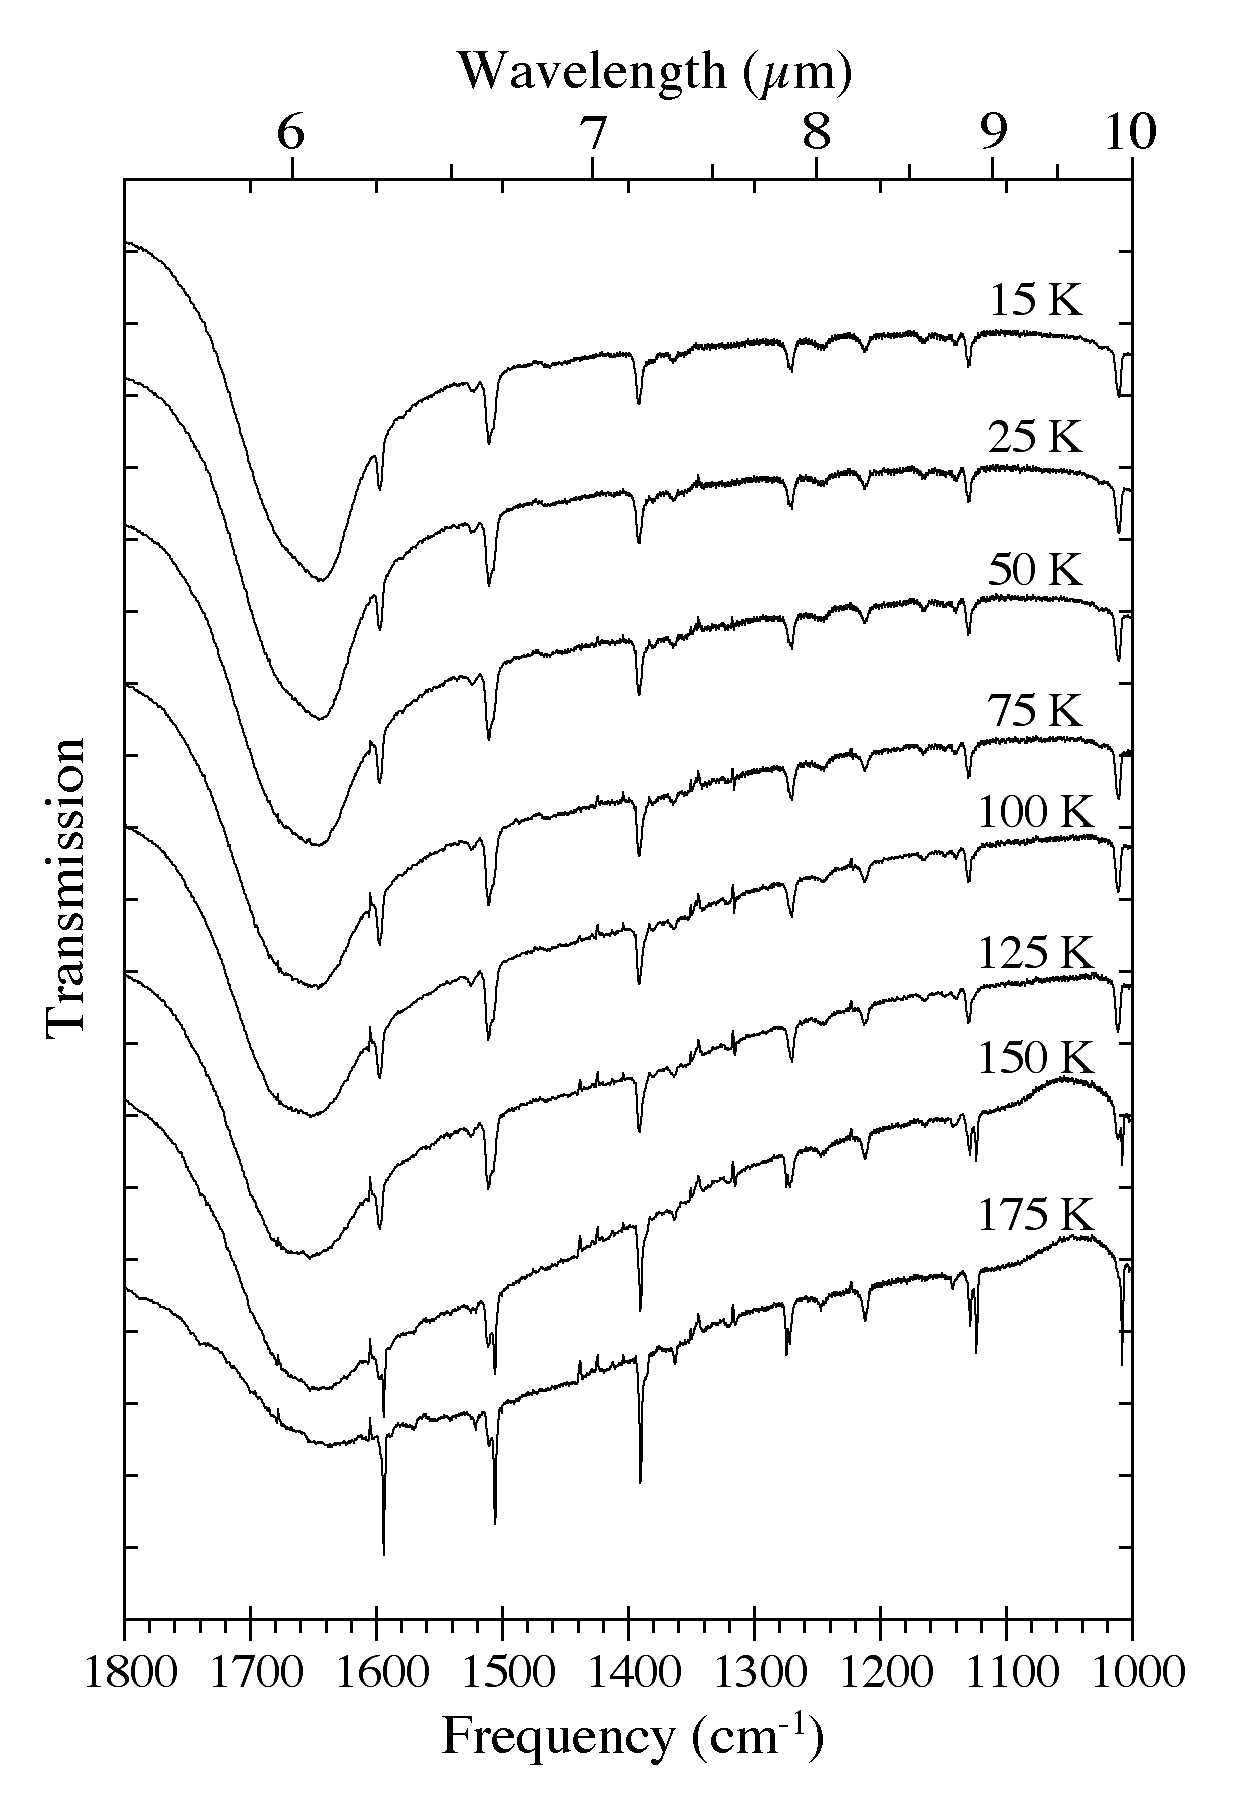
Figure 6. The 1800-1000 cm-1 (5.56-10.0 microns) spectra of an H2O/C10H8
~ 15 ice as a function of ice temperature. Spectra were taken from the
same sample after it was deposited at 15 K and subsequently warmed in
steps at 2 K/minute to temperatures of 25, 50, 75, 100, 125, 150, and
175 K. The very broad band centered near 1660 cm-1 (6.0 microns) is due to H-O-H bending vibrations of the H2O. Note the band splitting that occurs at temperatures above 125 K as the original amorphous H2O ice matrix is transformed into its cubic phase.
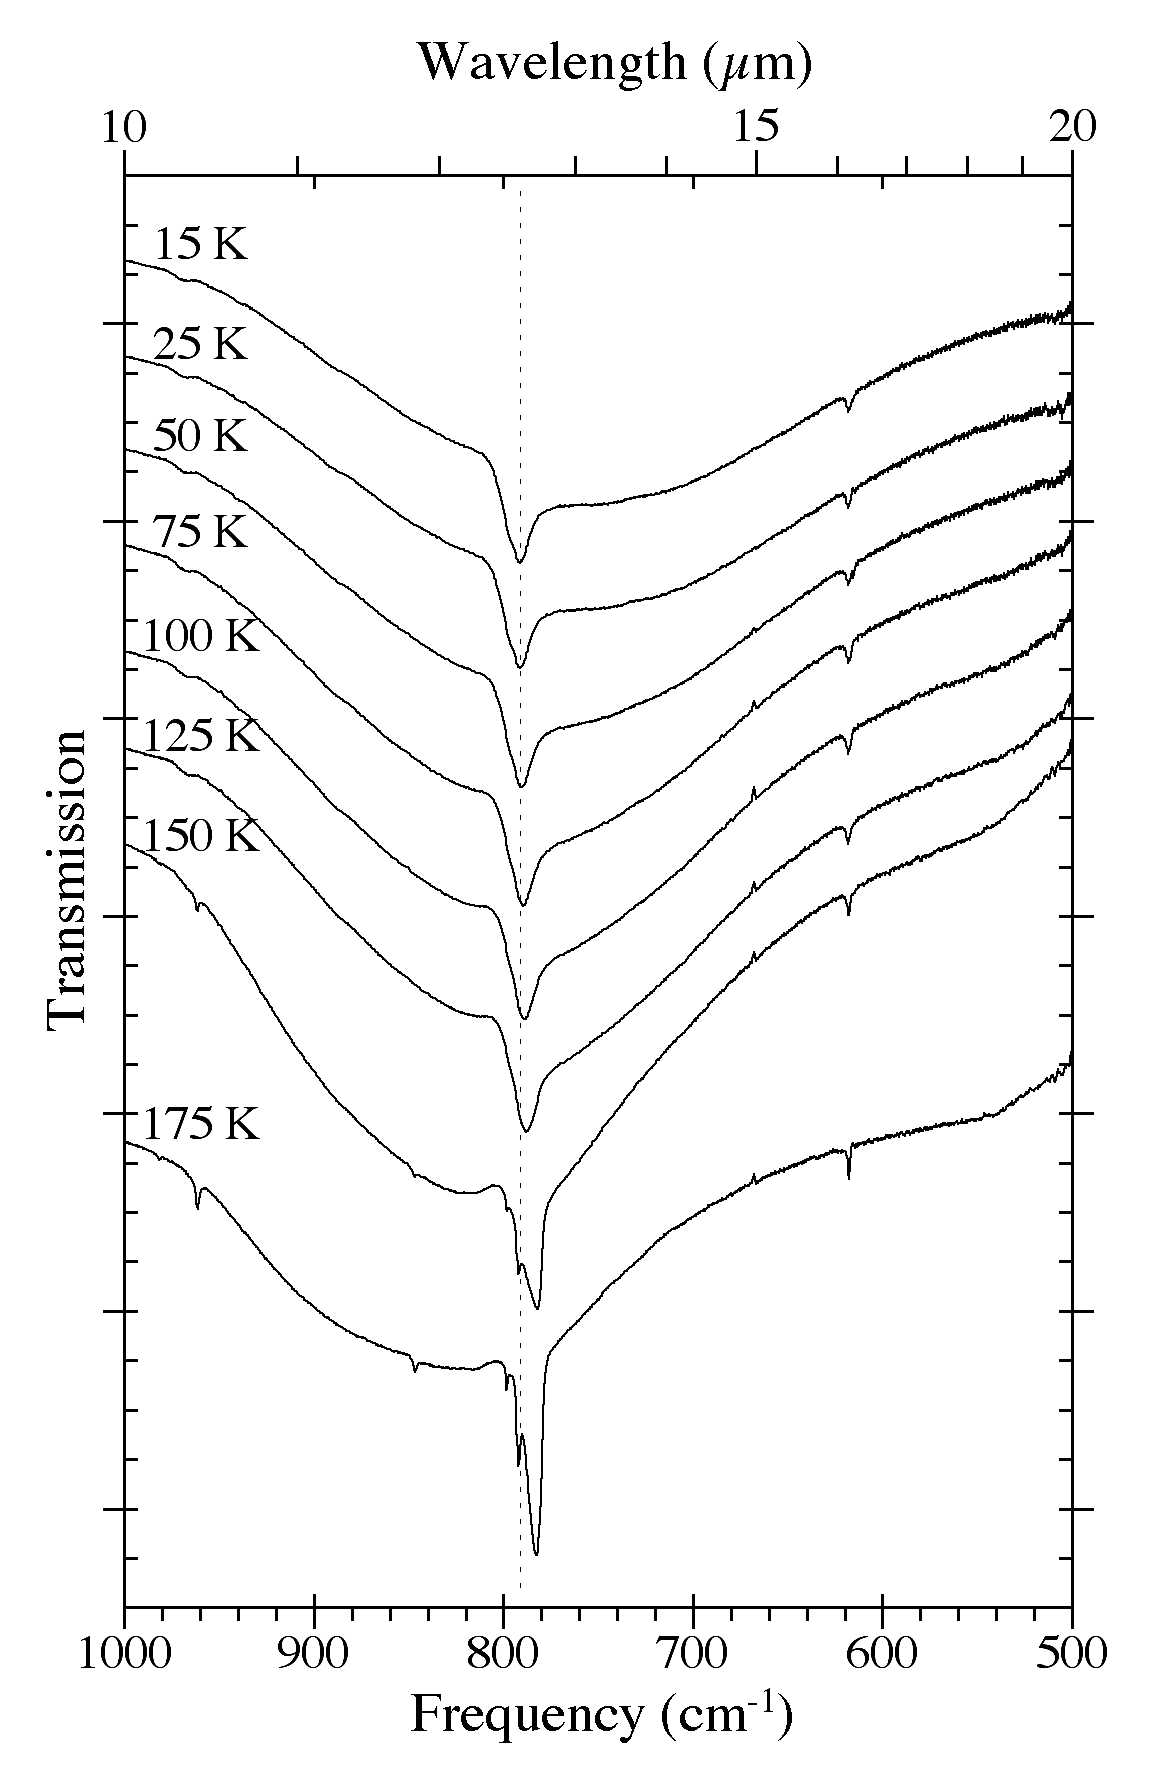
Figure 7. The 1000-500 cm-1 (10.0-20.0 microns) spectra of an H2O/C10H8
~ 15 ice as a function of ice temperature. Spectra were taken from the
same sample after it was deposited at 15 K and subsequently warmed in
steps at 2 K/minute to temperatures of 25, 50, 75, 100, 125, 150, and
175 K. The very broad band centered near 750 cm-1 (13.3 microns) is due to librational modes of the H2O. Note the band splitting that occurs at temperatures above 125 K as the original amorphous H2O ice matrix is transformed into its cubic phase.
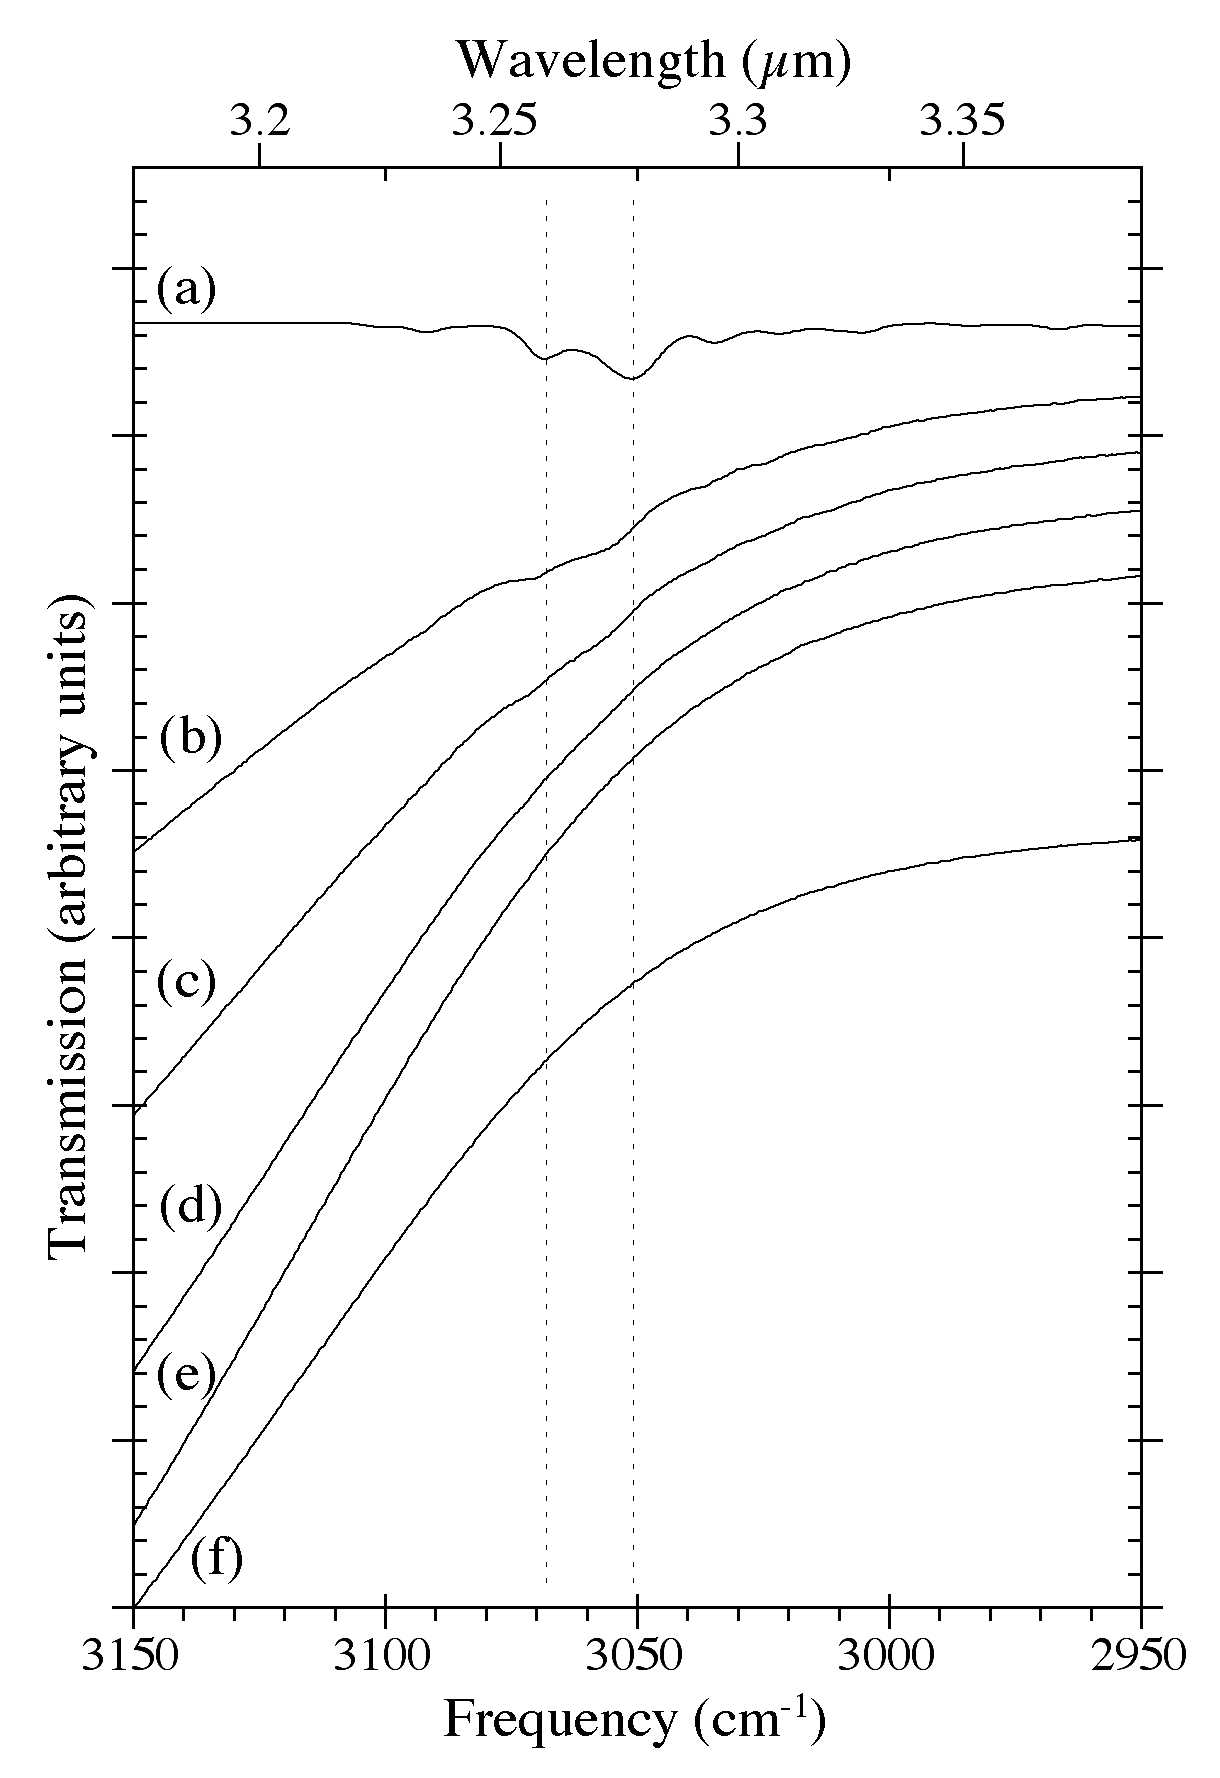
Figure 8. The 3150-2950 cm-1 (3.17-3.39 microns) IR spectra of H2O-C10H8 ices as a function of C10H8 concentration. The spectra are from (a) pure C10H8, (b) H2O/C10H8 ~ 8, (c) H2O/C10H8 ~ 15, (d) H2O/C10H8 ~ 40, (e) H2O/C10H8 ~ 80, and (f) pure H2O. The steep drop off to higher frequencies is due to the shoulder of the very strong O-H stretching band of H2O ice centered near 3300 cm-1 (3 microns). All spectra in this figure were taken from samples deposited and maintained at 15 K.
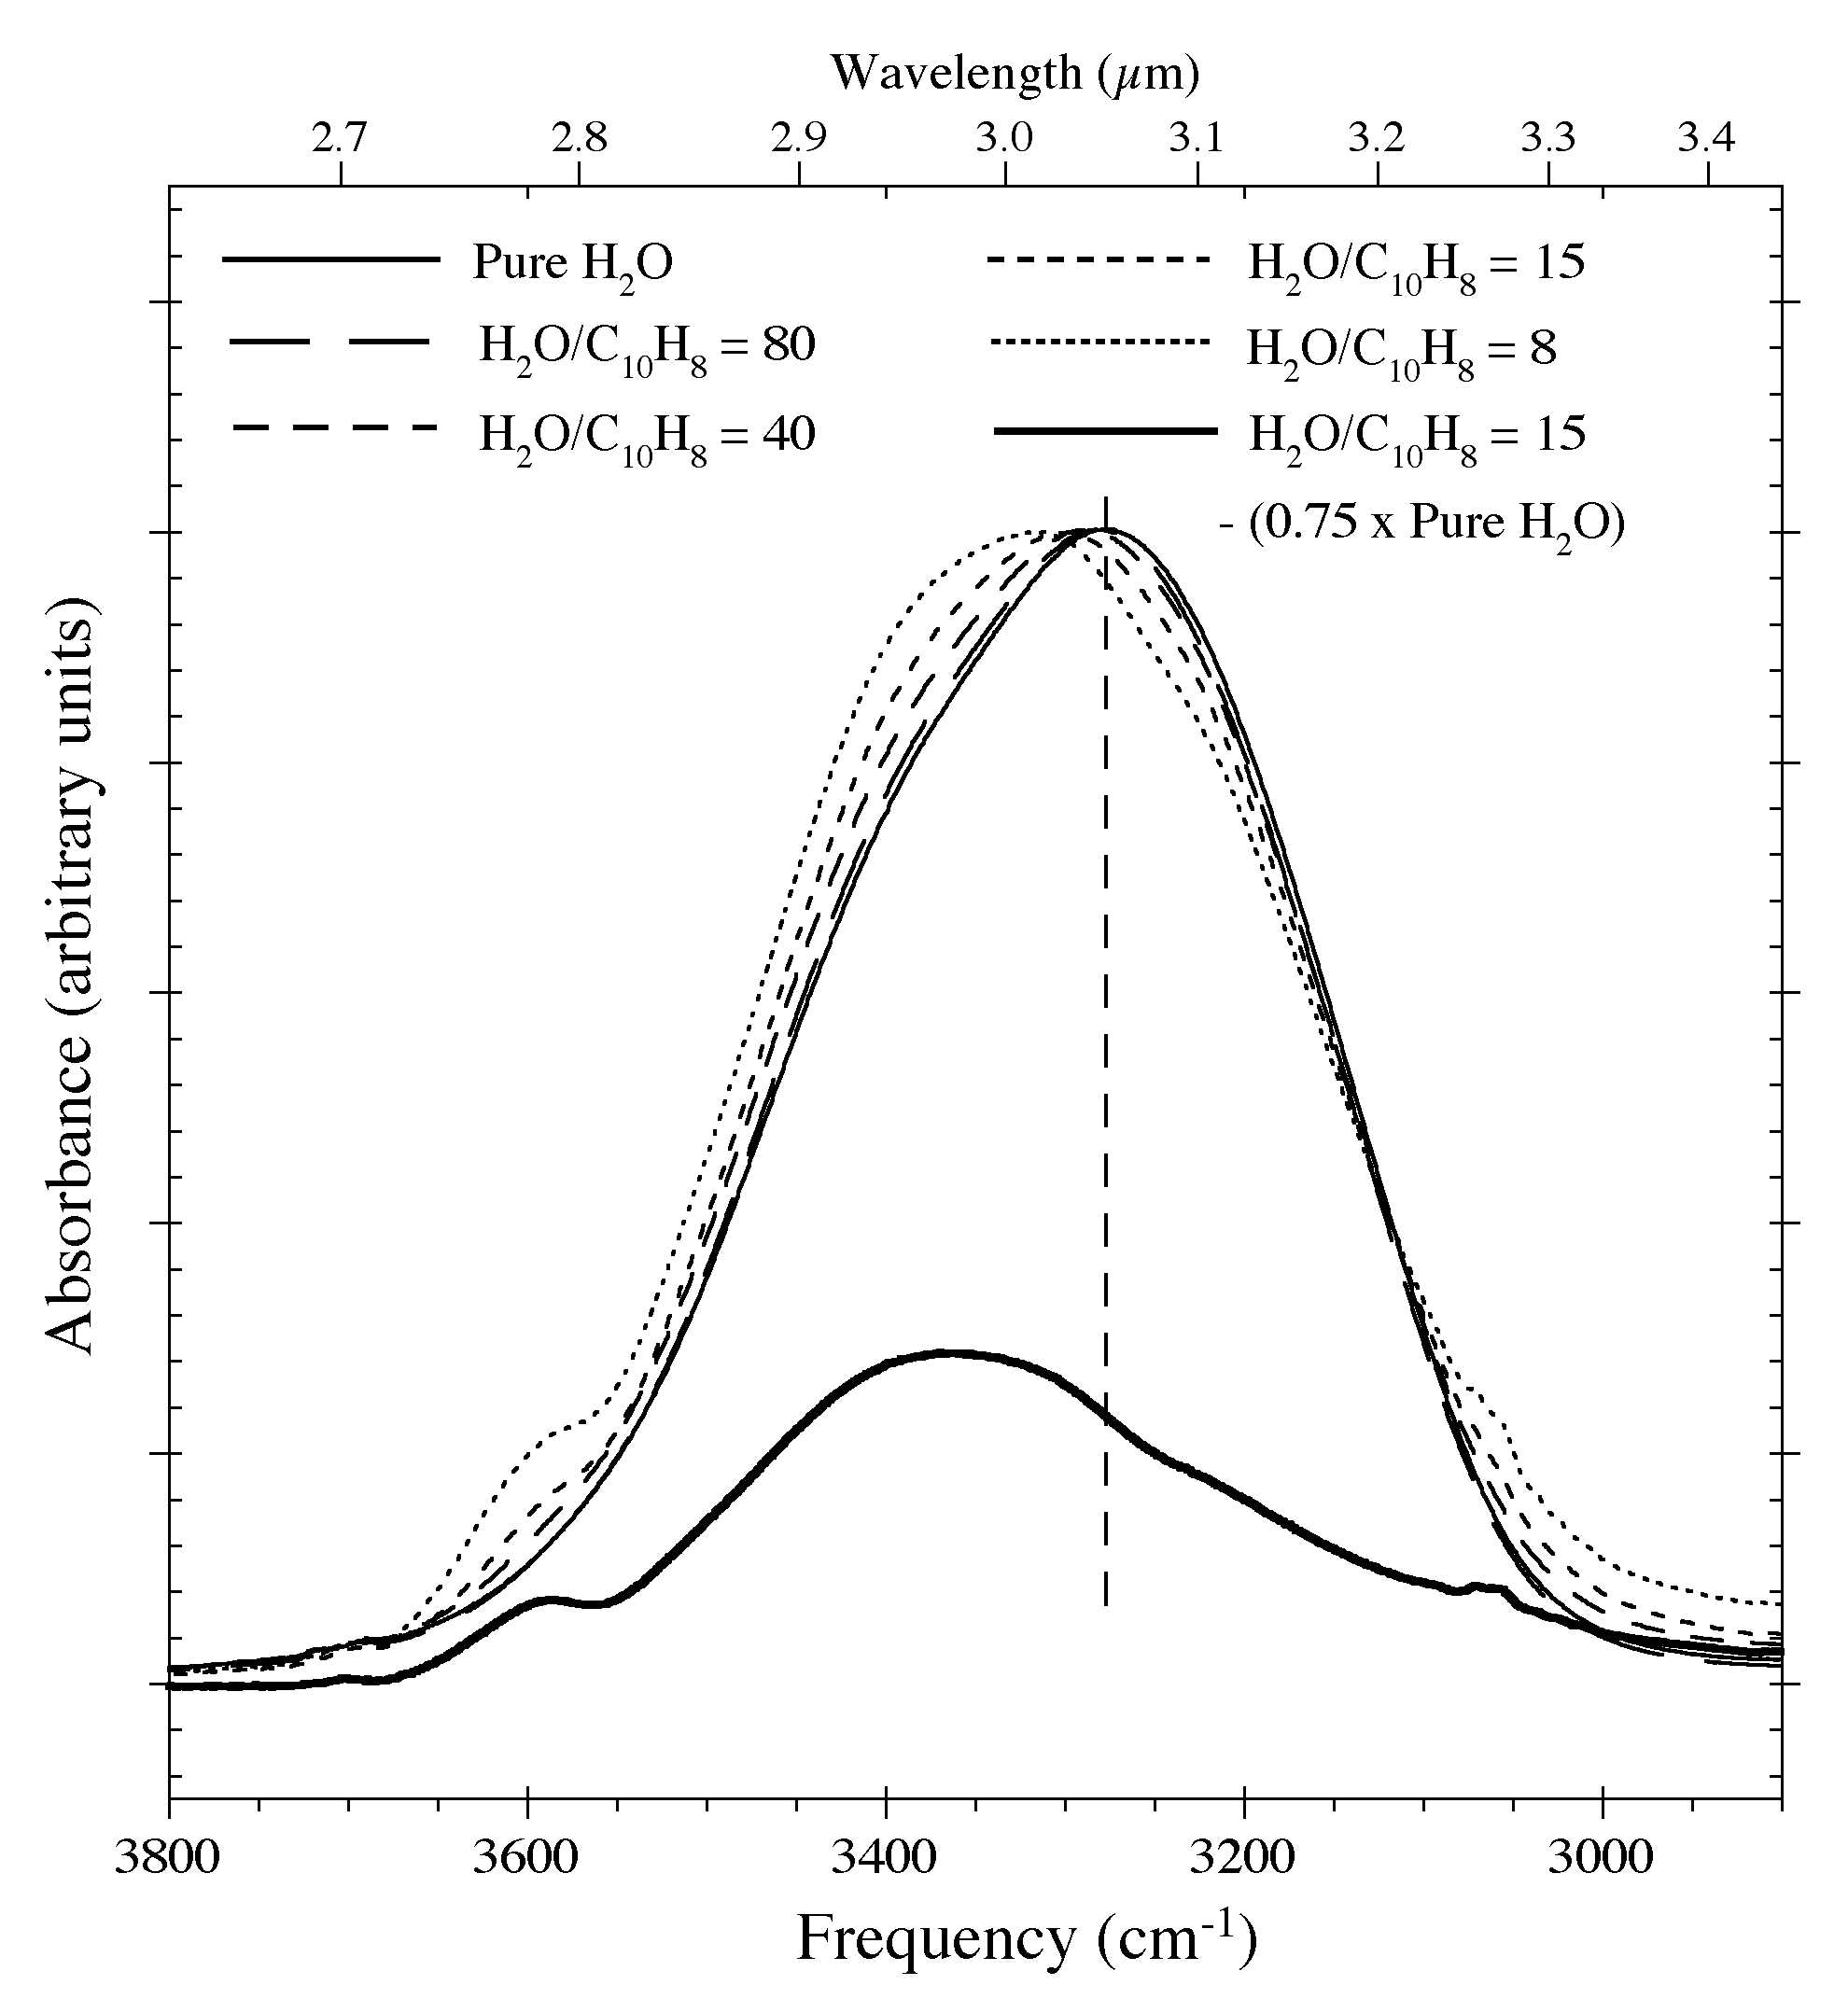
Figure 9. The profile of the O-H stretching
feature of a pure H2O ice and H2O-C10H8 samples having various C10H8 concentrations at 15 K. Increasing concentrations of C10H8 cause the feature's centroid to move to higher frequencies, produce a dangling O-H feature near 3600 cm-1
(2.8 microns), and alters the low frequency wing of the band. The lower
trace shows the residuals that remain after 75% of the 3.0 microns H2O feature is removed from the spectrum of the H2O-C10H8 ~ 15 sample using the spectrum of the pure H2O
ice. Such corrections improve the apparent spectral contrast of the
aromatic C-H stretching feature but cannot be taken to completion
because of the H2O-C10H8 interactions.
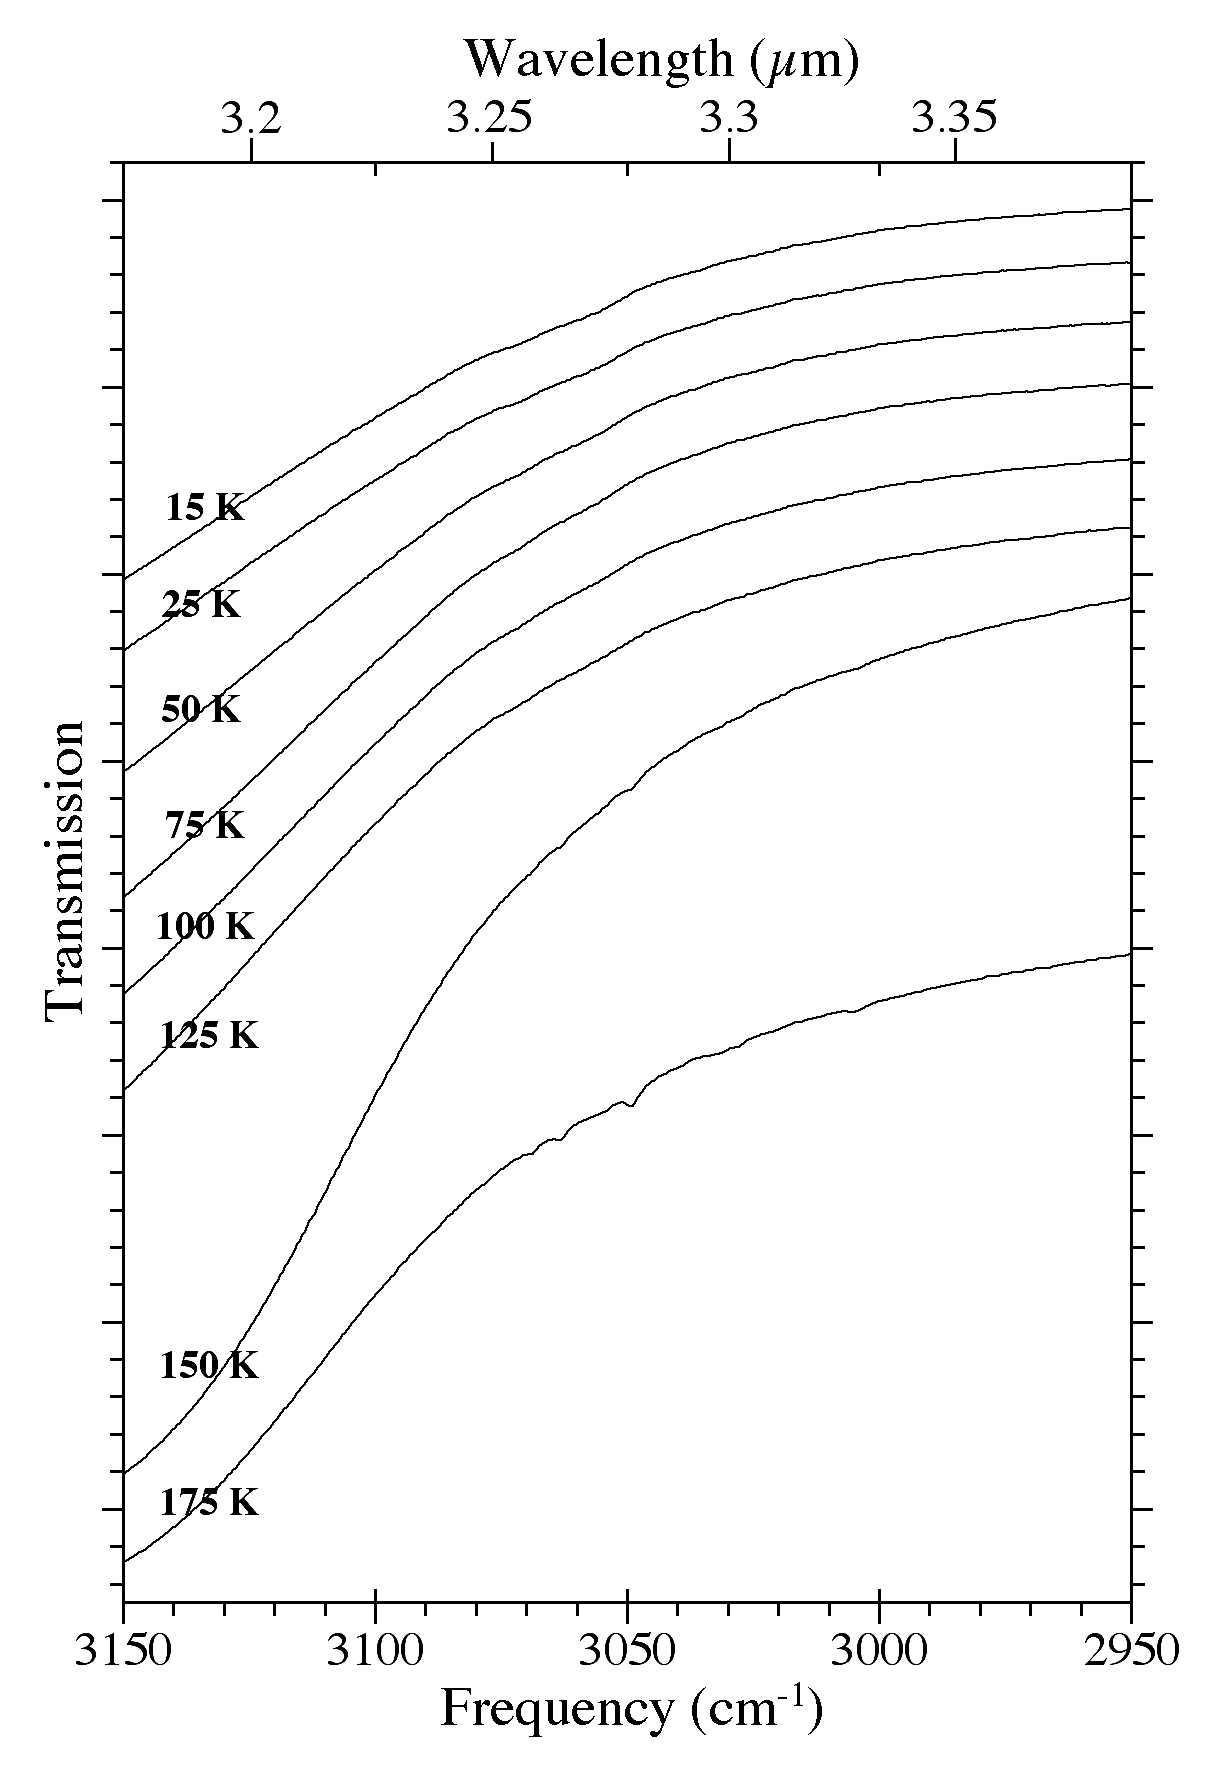
Figure 10. The 3150-2950 cm-1 (3.17-3.39 microns) spectra of an H2O/C10H8
~ 15 ice as a function of ice temperature. Spectra were taken from an
ice deposited at 15 K that was subsequently warmed to 25, 50, 75, 100,
125, 150, and 175 K.
These figures are from "The mid-infrared laboratory spectra of naphthalene (C10H8) in solid H2O" published in the Astrophysical Journal, Volume 607, Issue 1, May 2004, Pages 346-360, 2004 by Scott A. Sandford, Max P. Bernstein, and Louis J. Allamandola. A PDF version of this paper is available. Please contact us for a copy for the full-text of the article if it is otherwise inaccessible online.
References
Cané, E., et al., "The High-Resolution Infrared Specta of Naphthalene-h8 and Naphthalene-d8: Comparison of Scaled SCF and Density Functional Force Fields", Gazz. Chim. Italiana, 126, 289, 1996
Hudgins, D. and Sandford, S.A., "Infrared Spectroscopy of Matrix-Isolated Polycyclic Aromatic Hydrocarbons 1. PAHs Containing 2 to 4 Rings", J. Phys. Chem. A, 102, 329, 1998
|