|
Infrared (IR) spectra have demonstrated that solid CH4 is present on a number of outer Solar System objects, including Triton and the Kuiper Belt Objects Quaoar (Brown 2003 and personal communication), 90377 Sedna (Barucci et al. 2005), UB313 (Trujillo et al. 2005; Brown, Trujillo and Rabinowitz 2005), and FY9 (Barkume, Brown, and Schaller 2005). CH4 is present on Pluto, where it is thought to be frozen into N2 ice (Quirico et al. 1999; Grundy and Buie 2001), and it is known to be present in a number of comets (Gibb et al. 2003).
Since H2O is nearly ubiquitous in the outer Solar System (Roush 2001), CH4 on icy planetesimals is likely to come into contact with H2O ice, potentially changing its spectral properties. Since mathematical addition of spectra of pure materials is not equivalent to the spectra of actual mixtures, fitting CH4 profiles in spectra of outer Solar System bodies will require lab spectra of solid CH4 intimately mixed with H2O at relevant temperatures.
Near-IR spectra of CH4 as a pure solid and mixed in N2 have been measured in the lab at various temperatures and
concentrations (Quirico and Schmitt 1997, Grundy, Schmitt and Quirico 2002). Absolute absorption intensities (A values) for near-IR
absorptions of pure solid CH4 were published recently (Gerakines et al. 2005), and real and imaginary indices of refraction (ns and ks) have
been determined for both pure methane (Khare et al. 1989, Pearl et al. 1991) and pure H2O, albeit for just the hexagonal phase
(Grundy and Schmitt 1998). Despite this wealth of data, there is a lack of near-IR spectra of CH4 intimately mixed with solid H2O.
Since an interaction with H2O on a molecular level has been shown to cause significant changes in the position and profile of CH4 absorptions in the mid-IR (e.g., Hudgins et al. 1993), the presence of H2O could change peaks in the near-IR as well. This would complicate the interpretation of reflection spectra of outer Solar System bodies. In this paper we present near IR spectra of H2O-CH4 ice mixtures at various concentrations and temperatures from 15 to 150 K and document how peaks shift and broaden, both as a result of
interactions with H2O and as a result of changes in temperature. It is to be hoped that this data will be used in
conjunction with observations to constrain the state of solid CH4 on the surface of outer Solar System bodies.
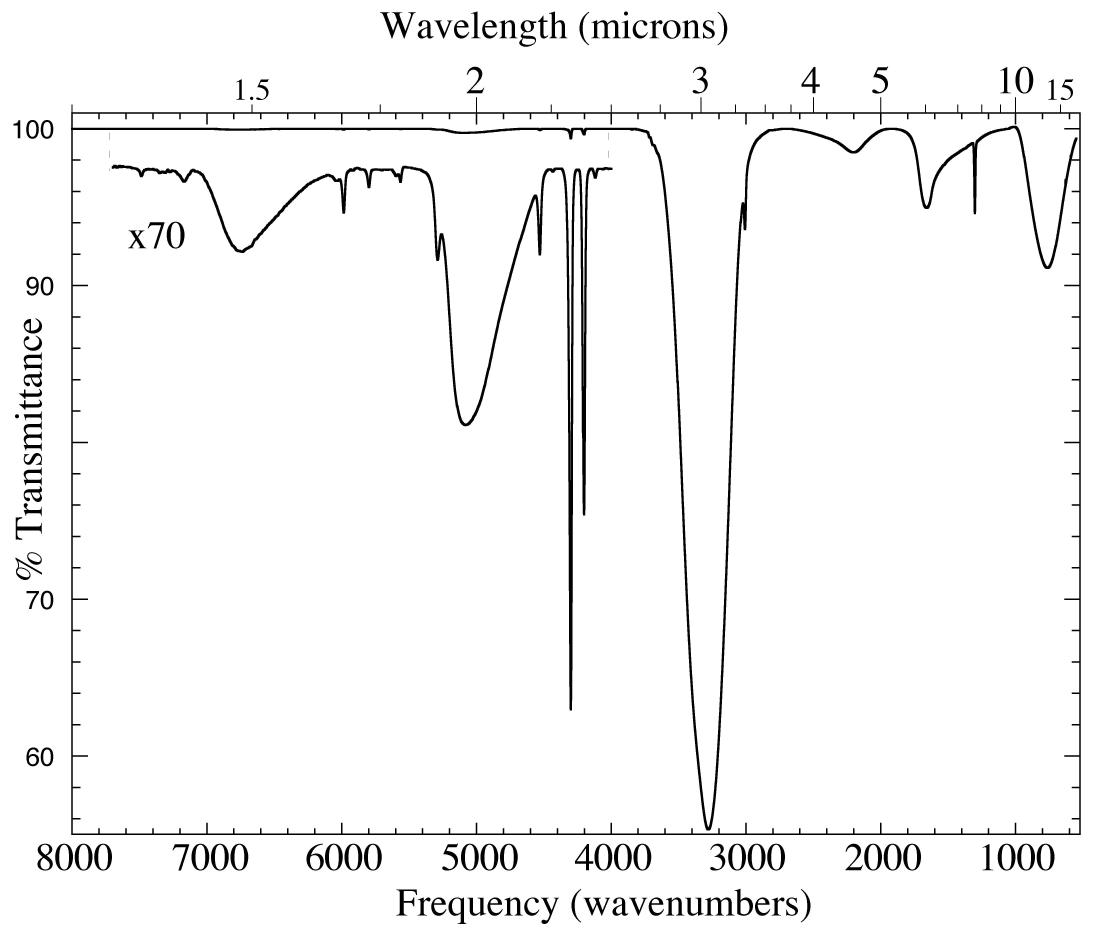
Figure 1. The 1.25-19.2 micron (8000-520cm-1) IR spectrum of an H2O/CH4=
20 ice mixture at 15 K. The inset shows a magnified view of absorptions too weak to be seen in the upper trace. The absorptions at ~1.5, 1.89,
~2, ~3, 4.5, ~6 and 13.3 micron (6700, 5300, 5100, 3250, 2200, 1600, and 750 cm-1) are all caused by solid H2O. The other sharper features are caused by CH4.
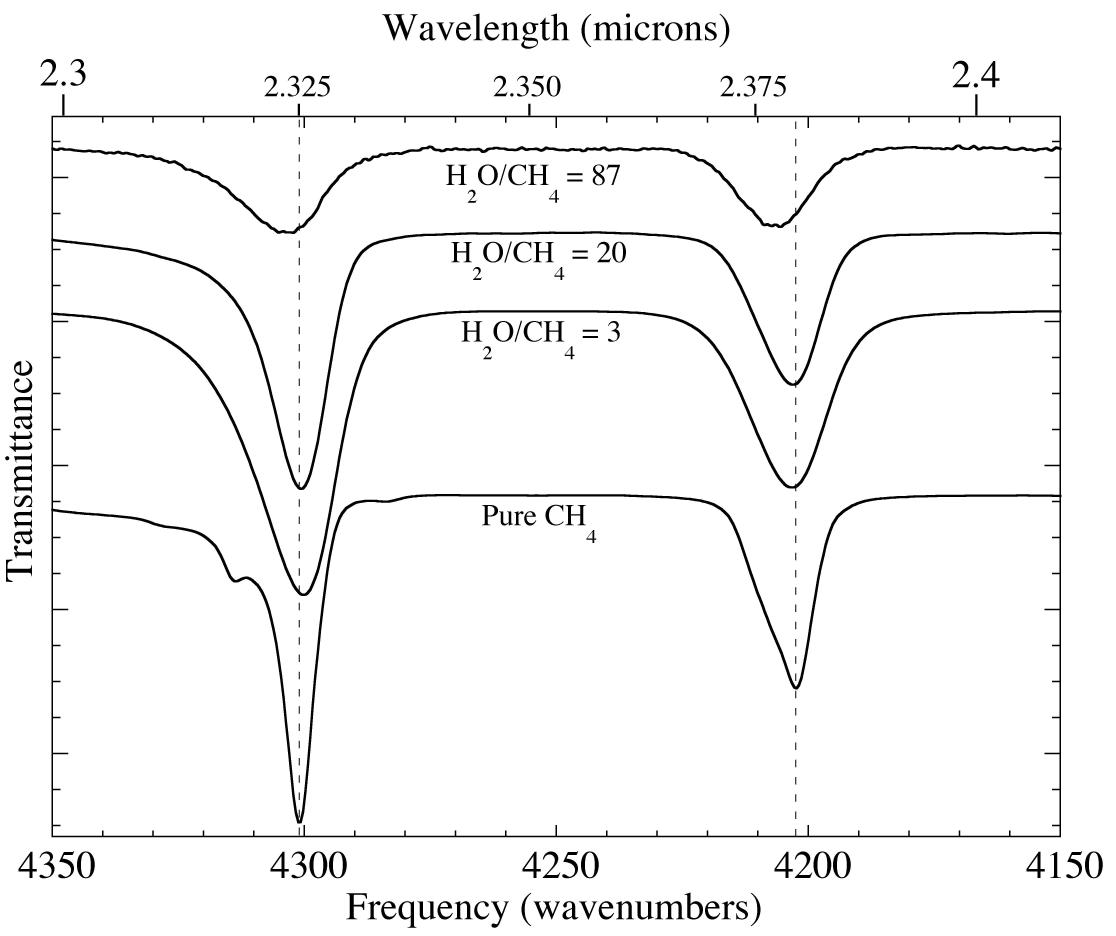
Figure 2. A comparison of the 2.3-2.4 micron (4350-4150 cm-1) IR spectra of pure methane and three H2O-CH4 mixtures at 15 K. The methane absorptions shift to shorter wavelength (higher frequency) and become broader when CH4 is diluted in H2O. In addition the relative peak areas also change.
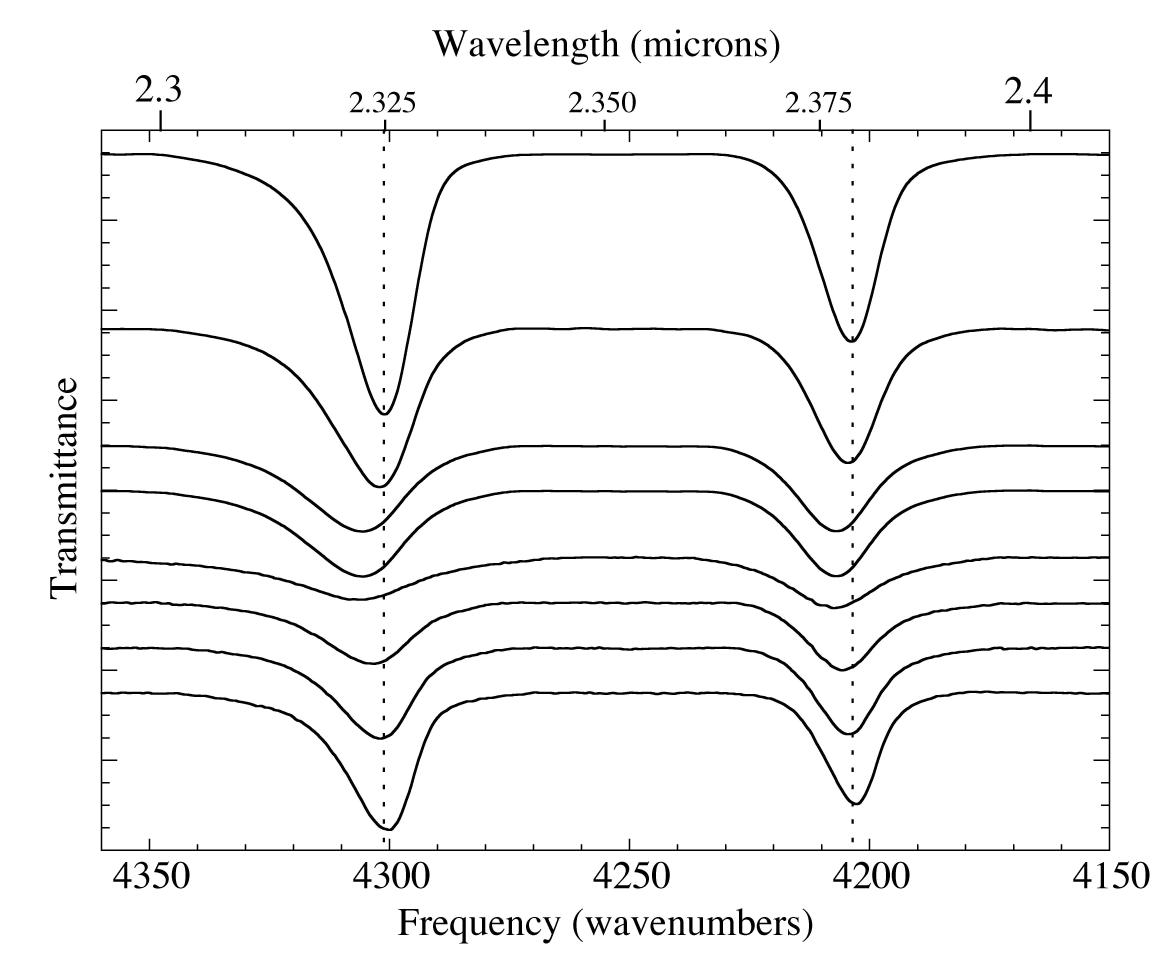
Figure 3. The 2.3-2.4 micron (4360-4150 cm-1) IR spectra of an H2O/CH4=20 ice mixture at 15 K (top) during warming up to 150 K (middle) and recooling back to 30 K (bottom). The temperature-dependant shifts in the position, width, and relative intensity of CH4 absorptions are reversible on recooling (see figures 4-6), despite the fact that the phase changes of the water ice are irreversible. The absolute intensity never entirely recovers, presumably due to sublimation of CH4.
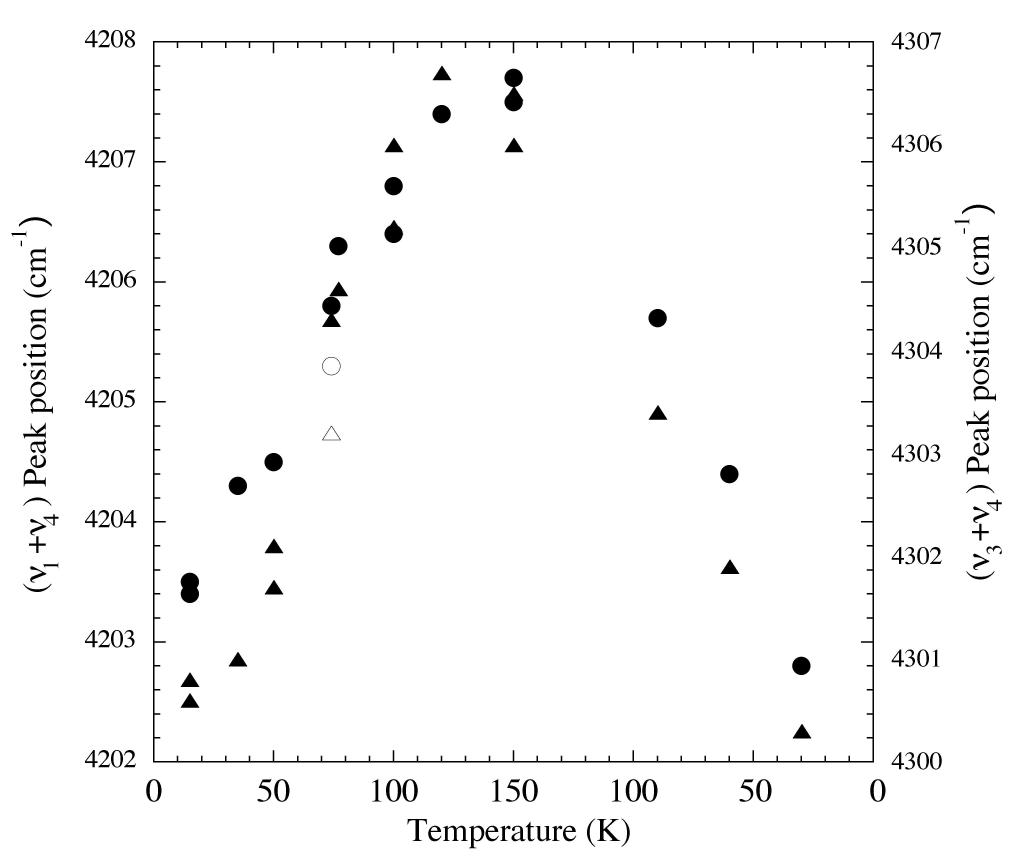
Figure 4. Peak position vs. temperature for the 2.32 and 2.38 micron (4300 and 4200 cm-1 (triangles and circles respectively) methane absorptions of an H2O/CH4 = 20 ice. From left to right vapor deposited at 15 K, warmed to 150 K, and then recooled to 30 K. The peak positions increase in frequency with increasing temperature, but return to essentially the original values on recooling. The empty symbols represent the positions of the same peaks vapor deposited at 74 K.
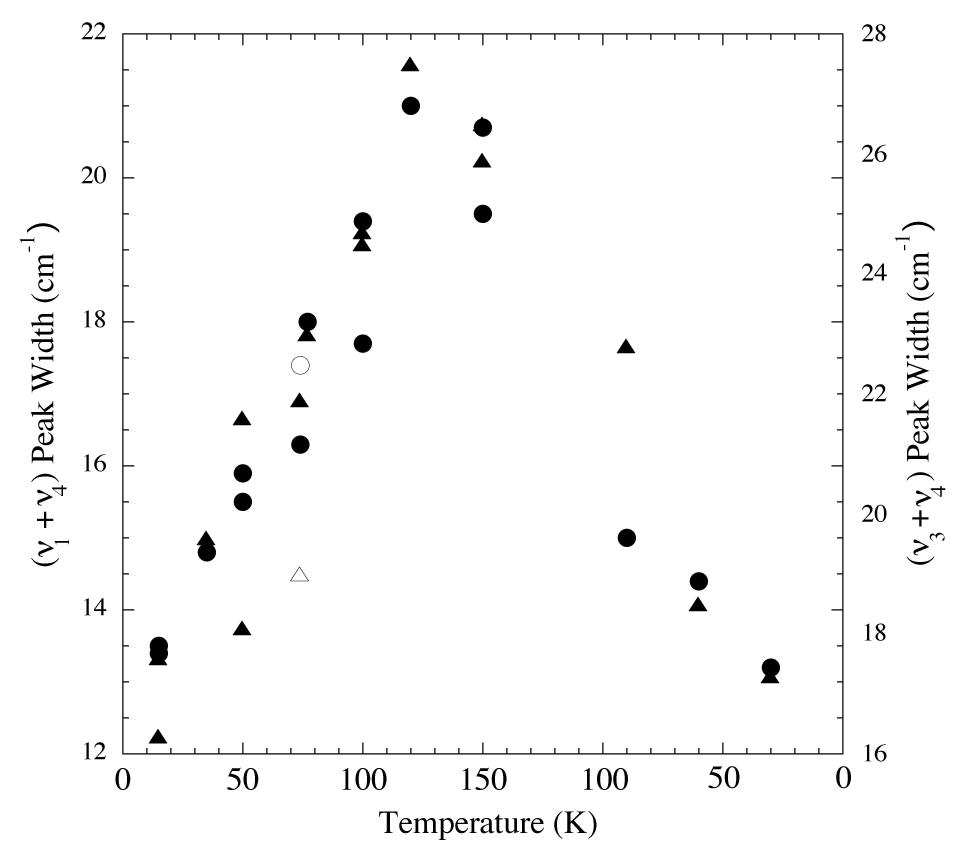
Figure 5. Peak widths vs. temperature for the 2.32 and 2.38 micron (4300 and 4200 cm-1; triangles and circles respectively) methane absorptions of an H2O/CH4 = 20 ice. From left to right vapor deposited at 15 K, warmed to 150 K,
and then recooled to 30 K. The peak widths increase with increasing temperature, but return to essentially the original values on
recooling. The empty symbols represent the widths of the same peaks vapor deposited at 74 K.
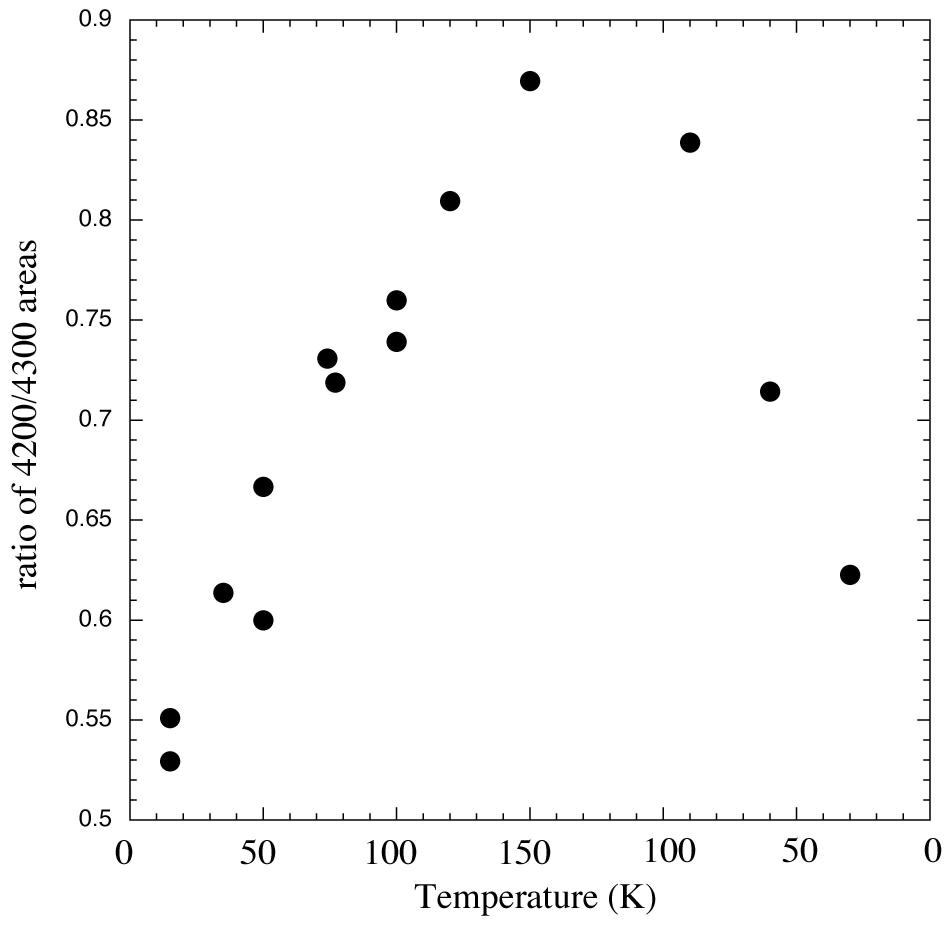
Figure 6. Ratios of areas of 2.38/2.32 micron (4200/4300 cm-1) methane absorptions vs. temperature for an H2O/CH4
= 20 ice vapor deposited at 15 K, warmed to 150 K, and then recooled to 30 K. Like the position and width, the ratio of areas seems to be
reversible on re-cooling.
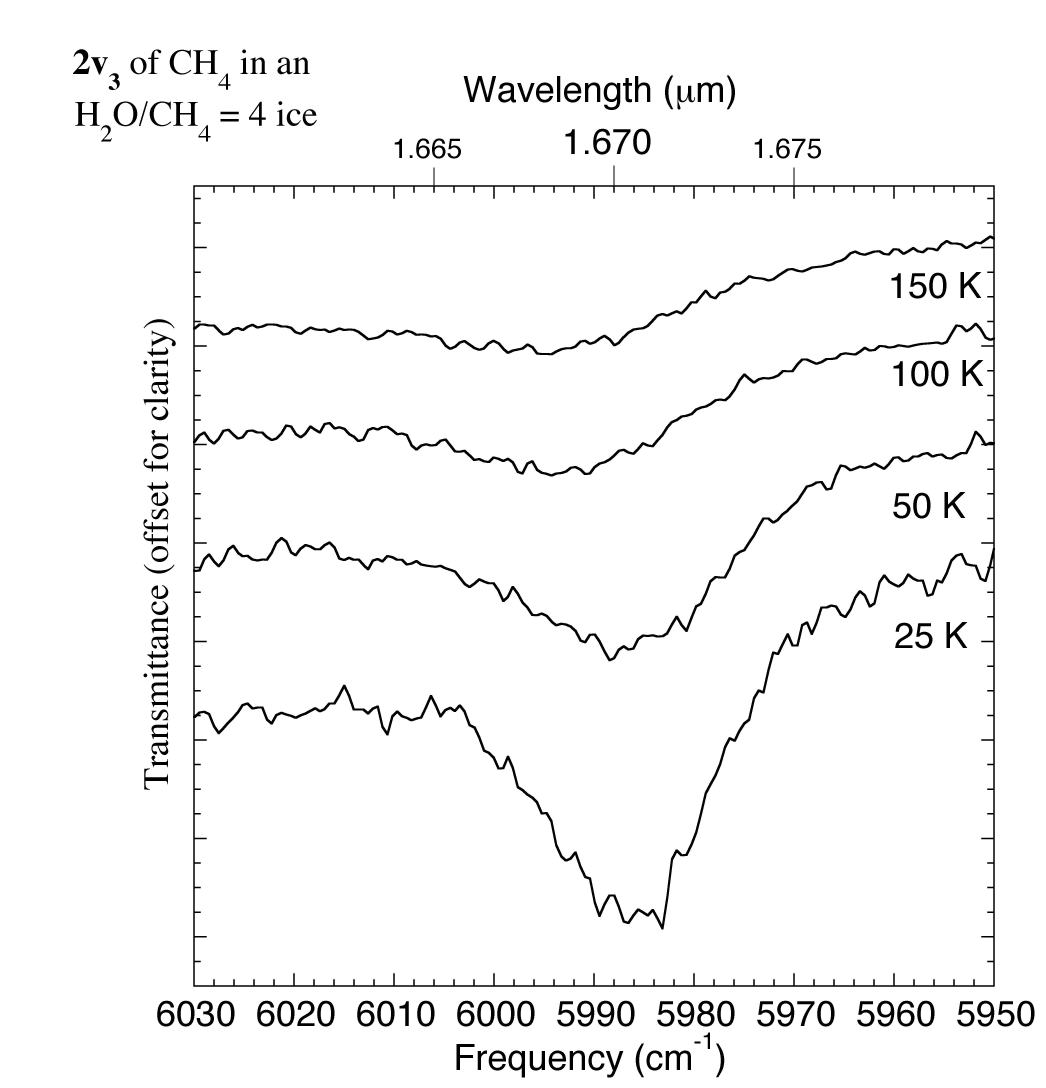
Figure 7. The 1.658-1.680 micron (6030-5950 cm-1) IR spectrum of an H2O/CH4 = 4 ice showing changes in the CH4 2v3 absorption with temperature. For comparison this feature was reported to be present in the spectrum of UB313 at 1.670 microns (5988 cm-1) by Trujillo et al. 2005.
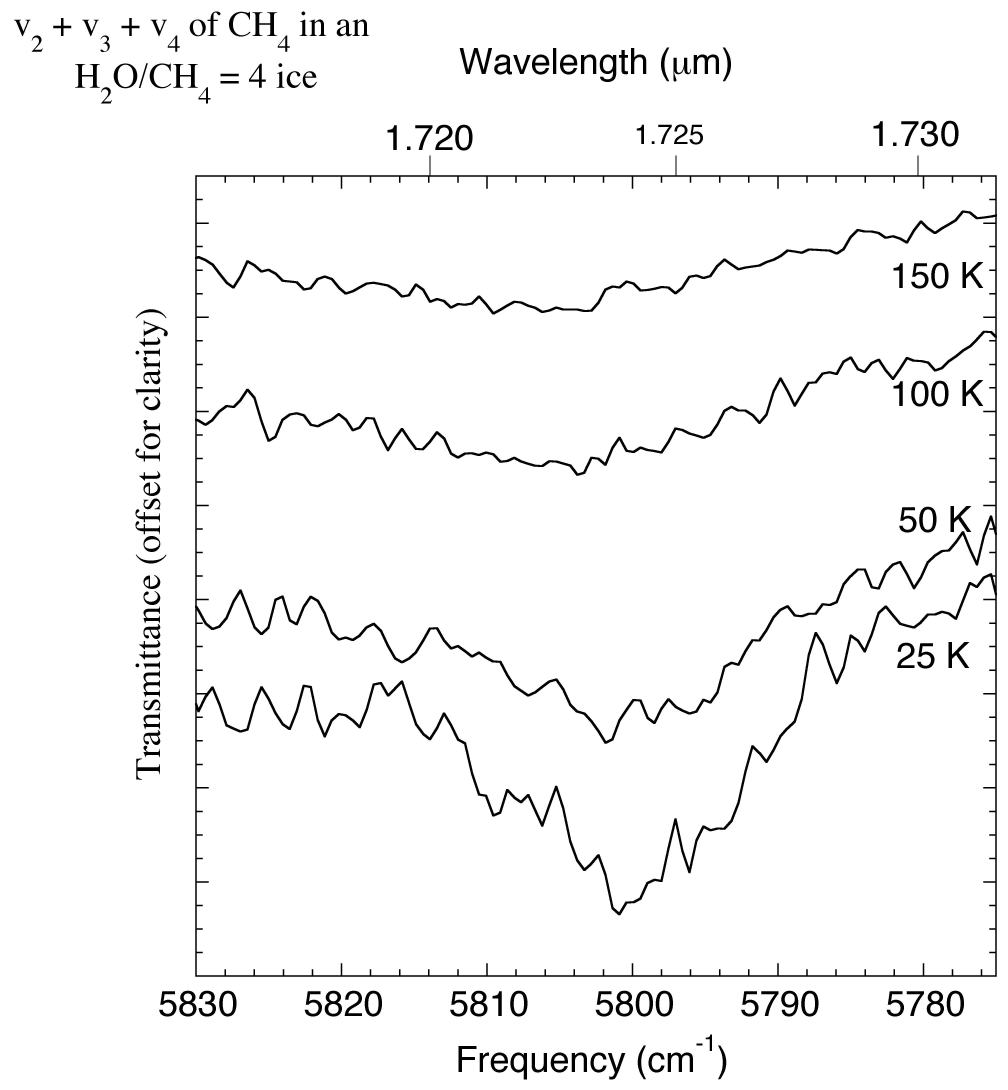
The 1.715-1.732 micron (5830-5775 cm-1) IR spectrum of an H2O/CH4 = 4 ice showing changes in the CH4 v2+v3+v4 absorption with temperature. For comparison this feature was reported to be present in the spectrum of UB313 at 1.670 microns (5988 cm-1) by Trujillo et al. 2005.
These figures are from "Near-infrared spectra of laboratory H2O-CH4 ice mixtures" published in Icarus, Volume 181, Issue 1, March 2006, Pages 302-208 by Max P. Bernstein, Dale P. Cruikshank and Scott A. Sandford. A PDF version of this paper is available. Please contact us for a copy for the full-text of the article if it is otherwise inaccessible online.
References
Brown, M. E., "The Composition of Kuiper Belt Objects", Bull. Am. Astron. Soc., 35, p. 969, 2003
Barucci, M. A., et al., "Visible and near-infrared spectroscopy of Centaurs and TNOs: update of the ESO Large Program", Bull. Am. Astron. Soc., 35, p. 990, 2003
Trujillo, C. A., et al., "Near Infrared Spectra from Mauna Kea of the New Brightest Kuiper Belt Object", Bull. Am. Astron. Soc., 37, p. 737, 2005
Brown, M. E., Trujillo, C. A., and Rabinowitz, D., "Discovery of a Planetary-sized Object in the Scattered Kuiper Belt", Astrophys. J., 635, p. L97, 2005
Barkume, K. M., Brown, M. E., and Schaller, E. L., "Near Infrared Spectroscopy of Icy Planetoids", Bull. Am. Astron. Soc., 37, p. 738, 2005
Quirico, E., et al., "Composition, Physical State, and Distribution of Ices at the Surface of Triton", Icarus, 139, p. 159, 1999
Grundy, W. M. and Buie, M. W., "Distribution and Evolution of CH4, N2, and CO Ices on Pluto's Surface: 1995 to 1998", Icarus, 153, p. 248, 2001
Gibb, E. L., et al., "Methane in Oort cloud comets", Icarus, 165, p. 391, 2003
Roush, T. L., "Physical state of ices in the outer solar system", J. Geophys. Res., 106(E12), p. 33315, 2001
Quirico, E. and Schmitt, B., "Near-Infrared Spectroscopy of Simple Hydrocarbons and Carbon Oxides Diluted in Solid N2 and as Pure Ices: Implications for Triton and Pluto", Icarus, 127, p. 354, 1997
Grundy, W. M., Schmitt, B., and Quirico, E., "The Temperature-Dependent Spectrum of Methane Ice I between 0.7 and 5 ?m and Opportunities for Near-Infrared Remote Thermometry", Icarus, 155, p. 486, 2002
Gerakines, P. A., et al., "The Strengths of Near-Infrared Absorption Features Relevant to Interstellar and Planetary Ices", Astrophys. J., 620, p. 1140, 2005
Khare, B. N., et al., "Optical Constants of Solid Methane", Bull. Am. Astron. Soc., 21, p. 982, 1989
Pearl, J., et al., "Optical constants of solid methane and ethane from 10,000 to 450 cm-1", J. Geophys. Res., 96(E2), p. 17477, 1991
Grundy, W. M. and Schmitt, B., "The temperature-dependent near-infrared absorption spectrum of hexagonal H2O ice", J. Geophys. Res., 103(E11), p. 25809, 1998
Hudgins, D., et al., "Mid- and far-infrared spectroscopy of ices - Optical constants and integrated absorbances", Astrophys. J. Supp. Ser., 86, p. 713, 1993
|